
Analysis · NBFC · SBFC Finance
Beyond GNPA: SBFC Finance’s Risk Signal Is Moving Upstream
Headline NPAs remain steady, but 0+ DPD, approval conversion, credit cost and Stage 2 provisioning point to pressure earlier in the credit funnel — a provisioning response developing ahead of the reported NPA line.
SBFC Finance closed Q1 FY27 with gross NPA at 2.66%, down 12 basis points year-on-year and only 5 basis points higher sequentially. Taken on its own, that number suggests a broadly steady asset-quality position.
The upstream indicators are less comfortable. During the quarter, 0+ DPD rose by about 70 basis points; management flagged leveraged stress in the sub-₹10 lakh segment; login-to-disbursement conversion moderated to 34% from 42%; credit cost moved to 1.45%; and Stage 2 ECL coverage had already been raised from roughly 6% to 16% by FY26-end, while total provisioning/assets reached 1.91% in Q1 FY27 — the highest level management says it has carried. For a secured book with relatively low LTV, that combination points more clearly to emerging cash-flow stress than, so far, to a sharp deterioration in realised credit losses.
The risk signal therefore sits earlier in SBFC’s delinquency curve than the headline GNPA ratio. Repayment behaviour, origination selectivity and provisioning intensity are all moving before any comparable deterioration in reported NPAs.
GNPA remains stable — but it is a late-stage indicator
For a lender, GNPA records stress only after it has already travelled through earlier stages of delinquency. That makes movement in 0+ DPD the more useful gauge of whether pressure is building before loans reach the NPA bucket.
SBFC’s GNPA moved from 2.74% at FY25-end to 2.61% at FY26-end and stood at 2.66% in Q1 FY27. Across the same period, credit cost rose from 0.97% in FY25 to 1.27% in FY26 and then to 1.45% in Q1 FY27. Headline NPAs have stayed within a narrow band while the cost recognised for credit risk has climbed — and in Q1 FY27 the earliest delinquency indicator, 0+ DPD, moved about 70 basis points even though GNPA barely changed.
Figure 01
GNPA has stayed range-bound while credit cost has climbed
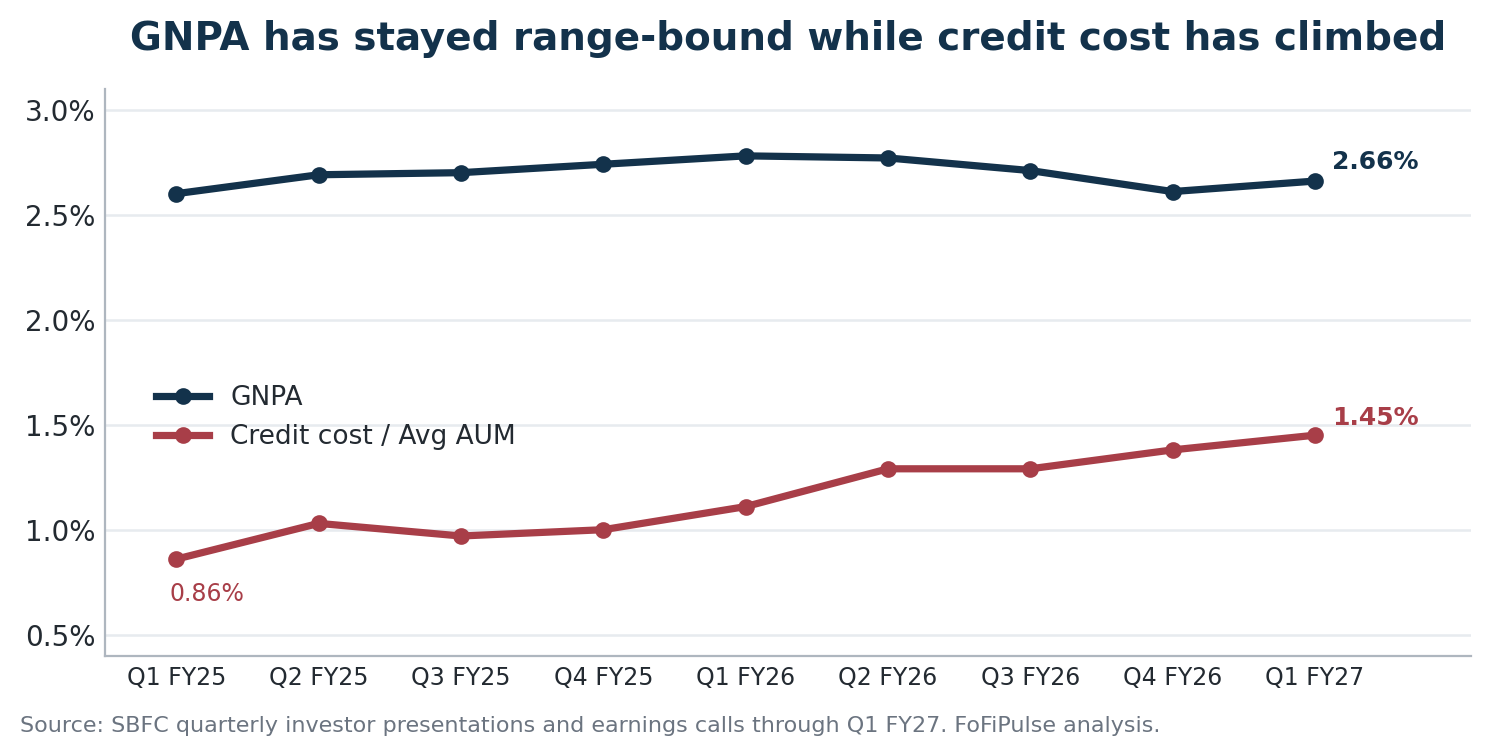
Source: SBFC quarterly investor presentations and earnings calls through Q1 FY27. FoFiPulse analysis.
Provisioning is moving — pre-emptive, or catching up?
During FY26, credit cost rose even as GNPA improved. The more significant change came in the ECL framework: management said it had concluded that provisioning was comparatively high in Stages 1 and 3 but low in Stage 2, and subsequently increased Stage 2 ECL coverage from around 6% to 16%. By Q1 FY27, total provisioning to assets stood at 1.91%, which management described as its highest level to date and roughly twice the regulatory requirement.
Those disclosures support two readings, and the data does not yet settle which. On the benign read, SBFC is recognising expected loss earlier, before accounts reach Stage 3. On the more cautious read, a near-tripling of Stage 2 coverage alongside a 70 basis point jump in 0+ DPD and explicit commentary on household cash-flow stress is management responding to deterioration it can already see forming. Cures and roll-forwards over the next few quarters will show which interpretation holds.
The Stage 2 change also needs to be separated from the overall provisioning build. Management described the FY26 ECL recalibration partly as a redistribution across stages: its refreshed model indicated comparatively higher provisioning in Stages 1 and 3 and lower provisioning in Stage 2. Raising Stage 2 coverage therefore did not translate one-for-one into an equivalent increase in aggregate provisions. Total provisioning/assets is the cleaner measure of the overall balance-sheet buffer; that subsequently stood at 1.91% in Q1 FY27.
Figure 02
Stage 2 ECL coverage nearly tripled by FY26-end
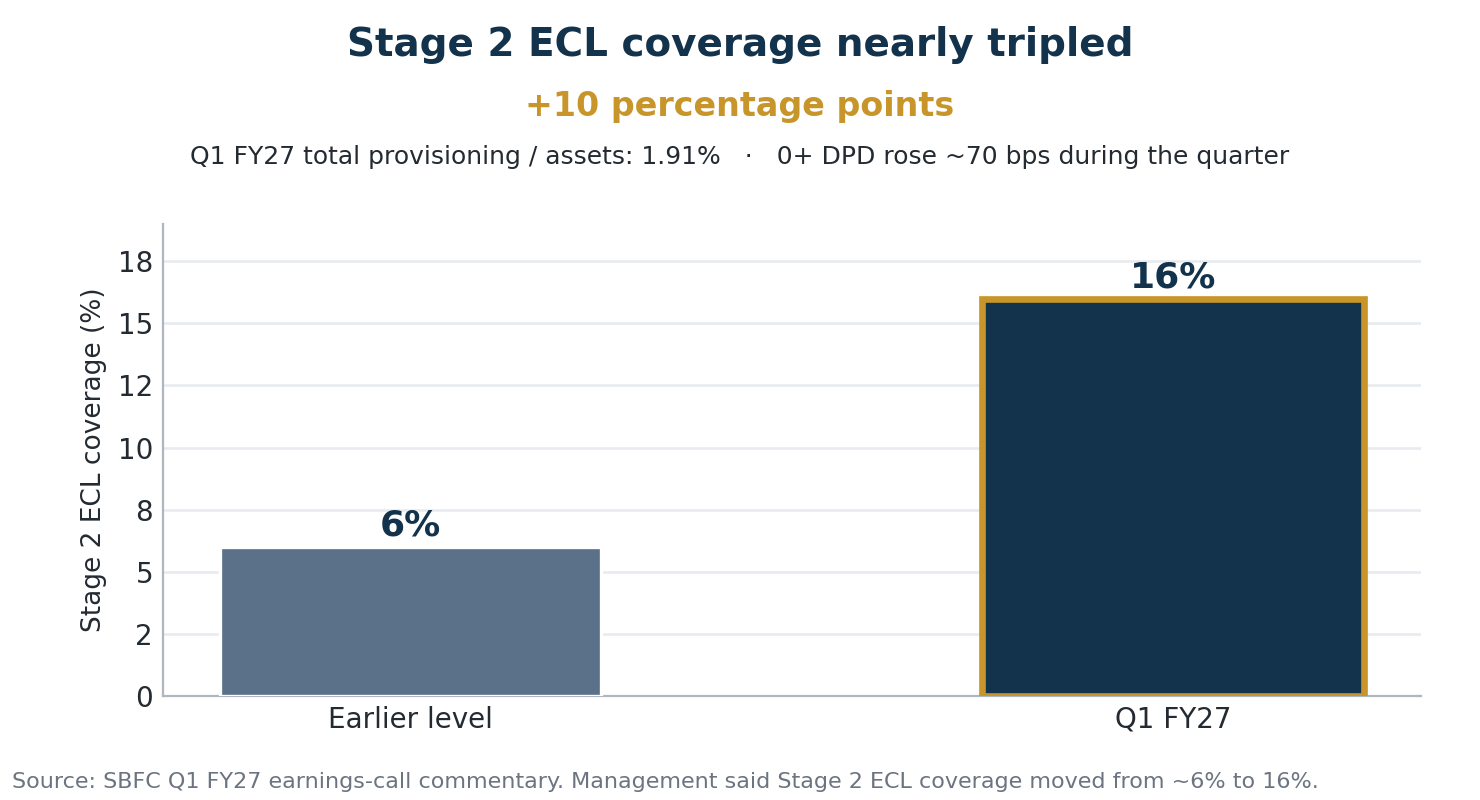
Source: SBFC Q4 FY26 and Q1 FY27 earnings-call commentary; management said Stage 2 ECL coverage moved from approximately 6% to 16%.
Underwriting has tightened before losses crystallise
The origination funnel shows the same shift in risk posture. Management said login-to-disbursement conversion had moderated to 34% from 42%. The decline cannot be attributed to tighter underwriting alone: the quarter also included changes to co-origination rules, movements in gold-loan eligibility and competitive pricing. Even so, management was explicit that SBFC was willing to walk away from business rather than relax pricing or credit discipline, and indicated conversion could remain around the mid-30s.
That sits alongside actions taken earlier in the cycle. SBFC had already tightened credit filters, moved away from smaller ticket sizes and raised the entry gate to a minimum CIBIL score of 700 in parts of its secured MSME origination.
The sequence is therefore visible across the funnel: borrower cash-flow pressure is appearing in early delinquency; origination is becoming more selective; conversion is lower; provisioning has increased; and GNPA has so far remained broadly contained.
Figure 03
Login-to-disbursement conversion has tightened
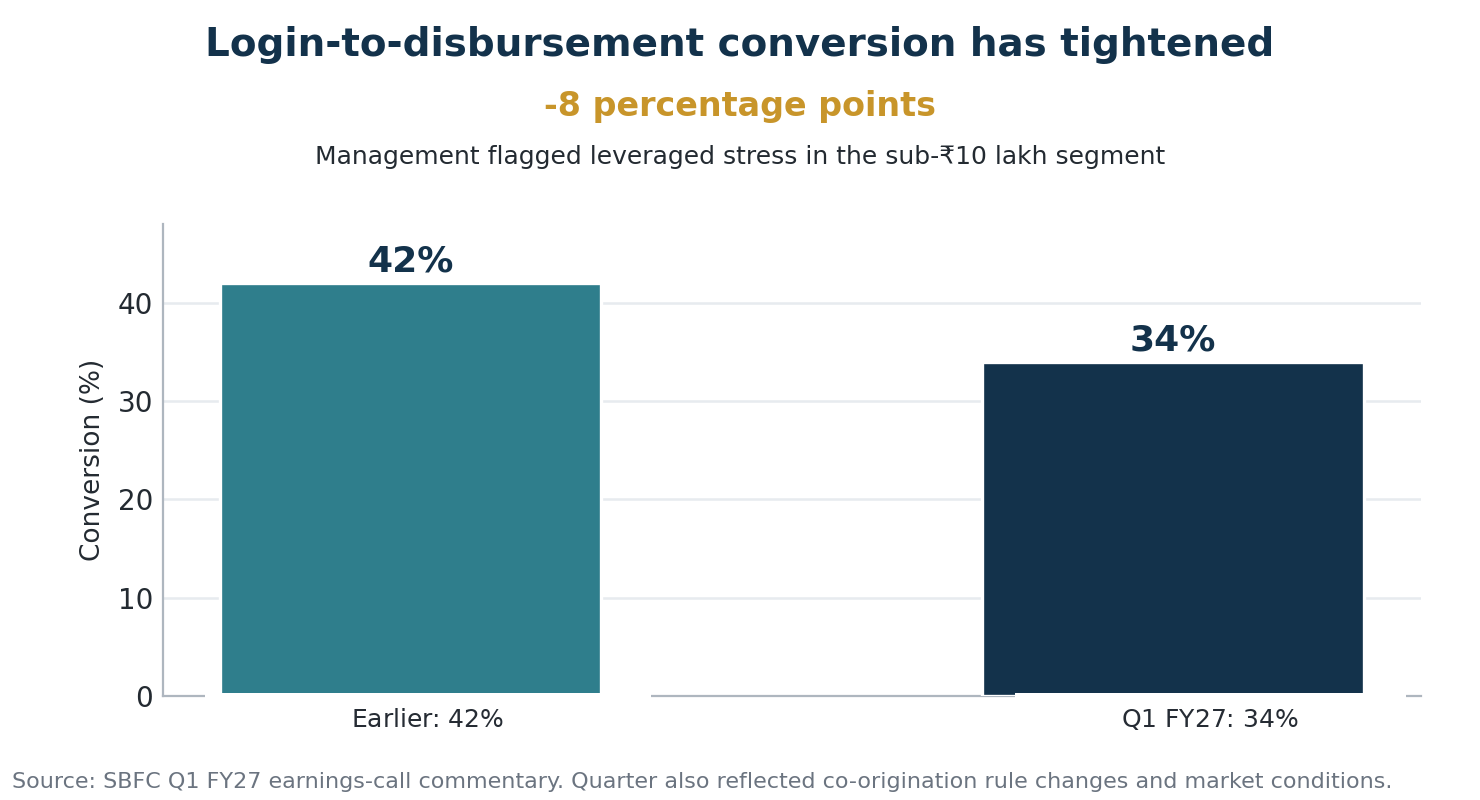
Source: SBFC Q1 FY27 earnings-call commentary. The quarter also reflected co-origination rule changes and market conditions.
The sub-₹10 lakh segment is where management sees leverage pressure
Management’s Q1 FY27 commentary singled out the sub-₹10 lakh borrower segment as an area showing leveraged stress, and linked repayment pressure to household cash flows: incomes had not changed materially, while inflation had reduced disposable income.
This distinction matters for secured MSME lenders. Stress in monthly repayment capacity can rise even when the borrower’s collateral position has not materially weakened, so early DPD can deteriorate without the eventual loss severity moving in the same proportion. For SBFC, the question is less about whether every early delinquency becomes an NPA — many will not — and more about the direction of cures, rollbacks and roll-forwards from these early buckets.
Collateral protection changes the loss equation
The underlying secured MSME book still carries several structural buffers. At FY26-end, 89.2% of secured MSME AUM came from borrowers with CIBIL scores above 700, average LTV was 42.6%, and 94% of MSME AUM was secured by self-occupied residential or commercial property.
These metrics should not be read as protection against delinquency — a low-LTV borrower can still miss an EMI if business or household cash flows weaken. What collateral changes is the loss-given-default side of the equation: if recovery values remain adequate, a rise in payment stress need not translate one-for-one into ultimate credit loss. SBFC’s current risk position therefore has two layers: repayment behaviour is under pressure, while collateral and borrower-quality markers remain comparatively strong.
Table 01
SBFC Finance: Key risk indicators snapshot
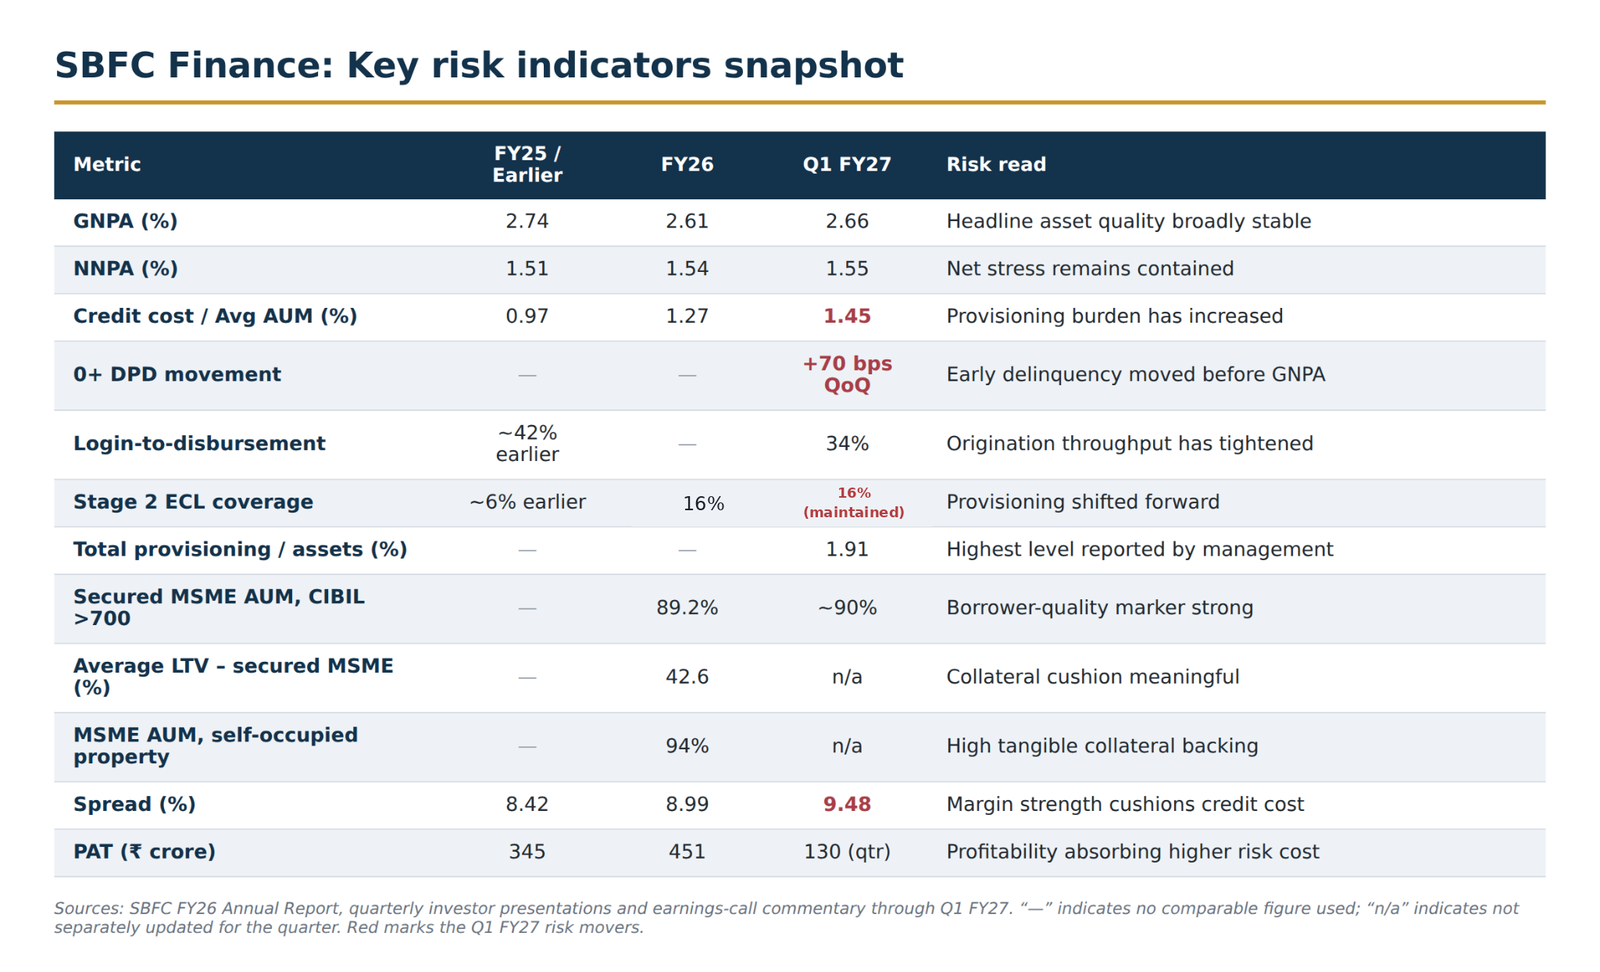
Sources: SBFC FY26 Annual Report, quarterly investor presentations and earnings-call commentary through Q1 FY27. “—” indicates no comparable figure used; “n/a” indicates not separately updated for the quarter.
Profitability is still absorbing the higher risk cost
The higher provisioning burden has not yet overwhelmed the earnings profile. Q1 FY27 PAT was ₹130 crore, up 29% year-on-year. Spread widened to 9.48%, roughly 80 basis points higher year-on-year, giving the company room to absorb a credit cost of 1.45% while maintaining return on average AUM of 4.53% and ROE of 14.73%. Capital remains ample, with CRAR near 32% even after a year of strong AUM growth.
That earnings cushion is relevant from a risk perspective: a lender that can recognise credit costs earlier without materially disrupting profitability has more room to stay conservative. The cushion is not permanent, however. If early delinquencies continue to migrate forward, provisioning requirements can rise further even if margins remain healthy.
What to track from here
GNPA will remain important, but it should not be the only number used to read SBFC’s credit trajectory. The more useful indicators are 0+ DPD and other early delinquency buckets; cure, rollback and roll-forward behaviour; login-to-disbursement conversion; Stage 2 ECL coverage; total provisioning to assets; and credit cost.
Together, those measures show whether stress is being contained near the front of the delinquency curve or migrating toward Stage 3 and reported NPAs. They also show whether tighter origination is reducing new-vintage risk while the existing book seasons through a more difficult repayment environment.
Conclusion
SBFC’s Q1 FY27 disclosures point to stress appearing primarily in repayment behaviour rather than yet in headline NPA formation. The company has responded by tightening origination, accepting lower conversion and moving provisioning forward through higher Stage 2 ECL coverage. At the same time, low LTVs, high tangible collateral backing and a large share of borrowers with CIBIL scores above 700 provide protection on the severity side of the credit equation.
Whether early buckets cure or roll forward will therefore matter more for SBFC’s near-term risk trajectory than a few basis points of movement in GNPA. The current disclosures are best read as a provisioning response developing ahead of the headline NPA line — not yet evidence of a broader credit-loss cycle.
Sources: SBFC Finance FY26 Annual Report; quarterly investor presentations; and earnings-call commentary through Q1 FY27.
Method note: FoFiPulse analysis uses company-reported metrics as disclosed. Spread is reported as spread (yield less cost of borrowing). Where a metric was not available on a comparable basis, no value has been inferred.