
Analysis · NBFC · Five-Star Business Finance
Five-Star’s Front-End Delinquency Indicators Are Improving — While GNPA Has Yet to Turn
Early DPD, Stage 2 and slippages have begun to improve after FY26’s stress, while Stage 3, write-offs and credit cost still reflect the existing stock of stressed loans. The distinction is between formation of new stress and the stock of existing stress.
Five-Star Business Finance ended Q1 FY27 with gross NPA at 3.46%, up from 3.37% at March 2026 and 1.79% at March 2025. Read in isolation, that would suggest the asset-quality deterioration that defined FY26 is still continuing.
But the earlier parts of the delinquency curve are now moving in the opposite direction. The current book improved to 83.30% from 82.69% sequentially. 1+ DPD fell to 16.70% from 17.31%, while 30+ DPD declined to 12.38% from 12.69%. The slippage ratio stayed at 0.70%, well below the 1.09% peak in Q3 FY26, and credit cost edged down to 1.85% from 1.88% in Q4.
The divergence matters. Five-Star’s front-end delinquency indicators are improving before the reported NPA stock has started to fall. That is consistent with a lender in which new stress formation is slowing while accounts that became delinquent during FY26 are still ageing through the harder buckets, being written off or being worked through recovery.
Figure 01
Front-end delinquency indicators have begun to improve
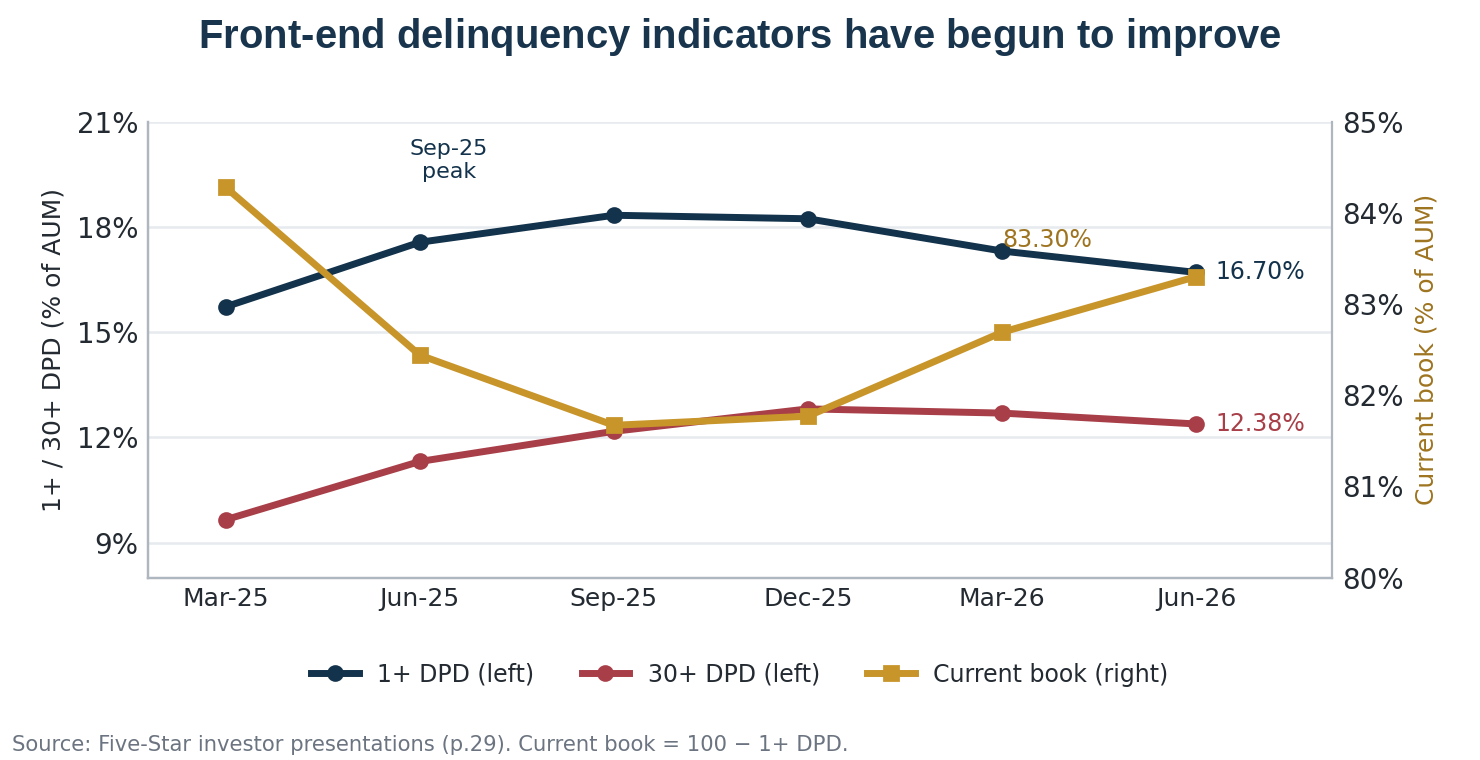
Source: Five-Star investor presentations (p.29). Current book = 100 − 1+ DPD.
Front-end delinquency indicators have begun to improve
The scale of the FY26 deterioration is visible in the early buckets. At March 2025, 15.72% of the book was 1+ DPD and 9.65% was 30+ DPD. By September, 1+ had reached 18.33%. By December, 30+ had risen to 12.81%.
The sequence has since reversed. 1+ DPD declined to 17.31% in March and 16.70% in June. 30+ eased from 12.81% in December to 12.69% in March and 12.38% in June. The current book, which had fallen to 81.67% in September, recovered to 82.69% by March and 83.30% in June.
Collections data support the same reading. Q1 FY27 unique-customer collection efficiency was 97.9%, versus 98.1% in Q4, while x-bucket collections were 99.2% versus 99.3%. Management described Q1 as seasonally soft, making the improvement in delinquency buckets notable even though collection efficiency itself was fractionally lower.
The relevant signal is therefore not that every risk metric has normalised. It is that the deterioration is no longer broad-based across the curve. The front end is improving first.
Stage 2 has declined while Stage 3 remains elevated
The stage composition makes the lag clearer. At March 2025, Five-Star reported 90.35% of the portfolio in Stage 1, 7.87% in Stage 2 and 1.79% in Stage 3. By March 2026, Stage 1 had fallen to 87.31%, Stage 2 had risen to 9.31% and Stage 3 to 3.37%.
The December 2025 position was close to the high-water mark for Stage 2: 9.63% of the book was in Stage 2 while Stage 3 was 3.18%. By June 2026, Stage 2 had fallen to about 8.92%, while Stage 3 increased further to 3.46%.
A falling Stage 2 ratio on its own would be ambiguous: loans can leave Stage 2 because they cure or because they roll forward into Stage 3. In Five-Star’s case, the simultaneous improvement in 1+ DPD, 30+ DPD and slippages strengthens the case that front-end formation has stabilised. At the same time, the continued rise in Stage 3 shows why it is too early to describe the book as fully normalised.
The credit curve is effectively operating with two speeds: softer buckets are improving, while the hard-bucket stock is still clearing.
Figure 02
Stage 2 has declined while Stage 3 continues to rise
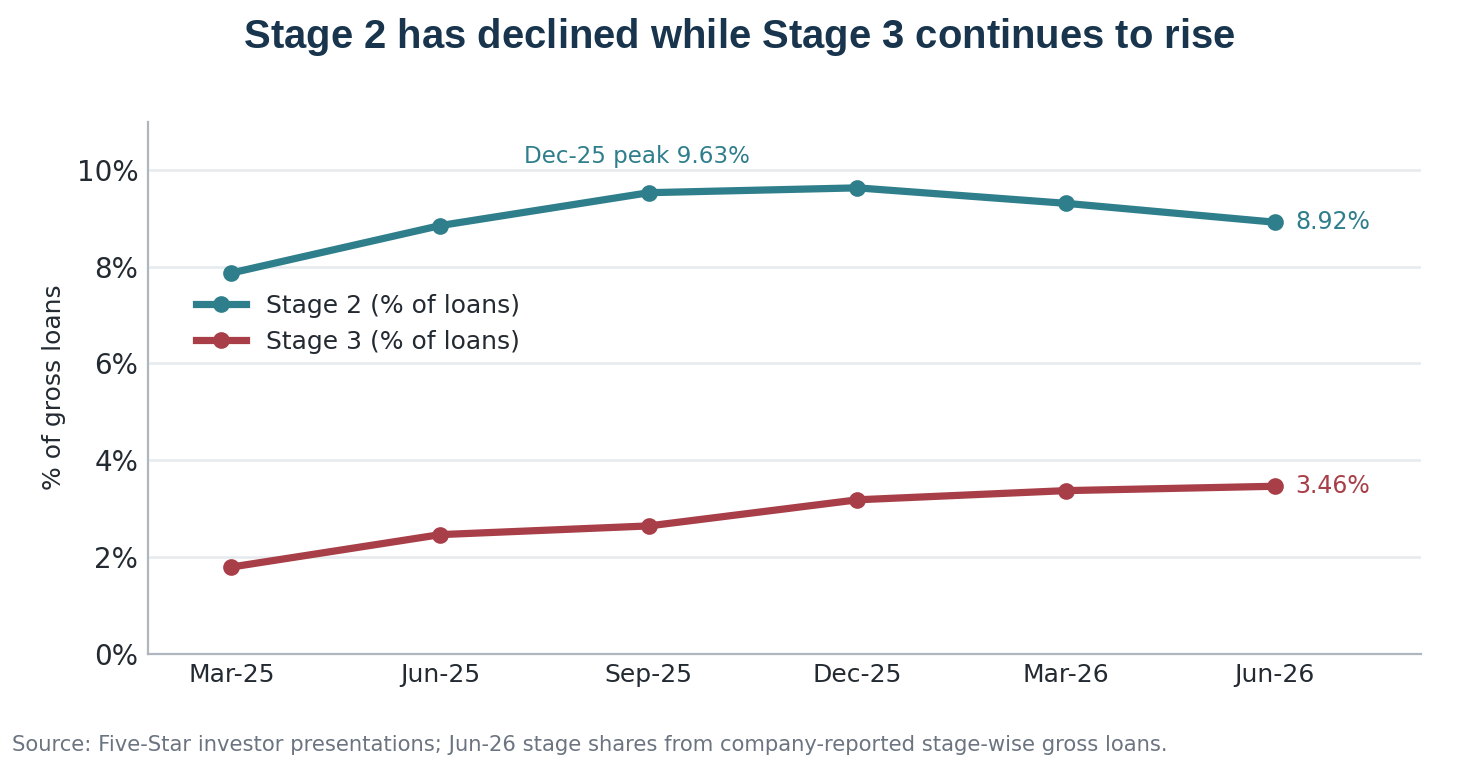
Source: Five-Star investor presentations; Jun-26 stage shares from company-reported stage-wise gross loans.
The collections model is designed to limit flow-forward, not rely on large rollbacks
Five-Star’s operating response during FY26 helps explain why the early buckets are the first place to look. The company created three collection verticals: current accounts largely remain with the Business team; high-vintage current and delinquent accounts move to a dedicated Collections team; and deep-delinquent or NPA accounts are handled by Legal Recovery.
It also increased reminders, alerts and automated calling, while the share of digital collections rose from 53% in March 2024 to 84% in March 2026. The objective is to limit flow-forward from the current bucket rather than depend on large catch-up payments later.
Management’s rollback data are consistent with that framework. It says rollbacks are generally around 4–5% in the softer 1–30 and 31–60 buckets, and about 2–3% in 61–90. For this borrower segment, many customers cannot simply pay multiple instalments in one month and jump backwards through buckets. Holding customers in the same bucket and controlling flows therefore matters more than relying on large rollbacks.
That makes the current-book ratio and x-bucket collection efficiency especially useful indicators for Five-Star. Management is targeting a current book of about 85% by FY27-end, against 83.30% in June, and 30+ DPD below 12%.
The cost of FY26 stress is still visible in credit cost and write-offs
The improvement in slippages has not yet translated into an equivalent decline in credit cost. Credit cost / average AUM rose from 0.90% in Q4 FY25 to 1.58% in Q1 FY26, 1.60% in Q2, 1.76% in Q3 and 1.88% in Q4. It eased only marginally to 1.85% in Q1 FY27.
Slippages have moved faster. The ratio rose from 0.45% in Q4 FY25 to 0.81% in Q1 FY26, eased to 0.67% in Q2, peaked at 1.09% in Q3 and fell to 0.70% in Q4, where it remained in Q1 FY27. That pattern is consistent with new problem formation improving before the accumulated stressed stock has been fully provided for, written off or recovered.
Write-offs remain elevated. Five-Star wrote off roughly ₹166.5 crore in FY26, versus about ₹54.2 crore in FY25. Q1 FY27 included about ₹60 crore of write-offs, and management has guided to ₹225–250 crore for the full year, implying a broadly similar quarterly run-rate for the remaining quarters.
Management characterises these as technical write-offs and says recovery efforts continue. Q1 included about ₹35 crore of combined recoveries from write-offs and NPA settlements, including roughly ₹7–8 crore recovered specifically from written-off accounts.
There is also an accounting-comparability point. Five-Star reports credit cost on a gross basis: recoveries from written-off loans are recognised in other income rather than netted against credit cost. Its reported credit-cost ratio therefore should not be compared mechanically with lenders that net recoveries into the same line.
Figure 03
The slippage ratio has declined faster than credit cost
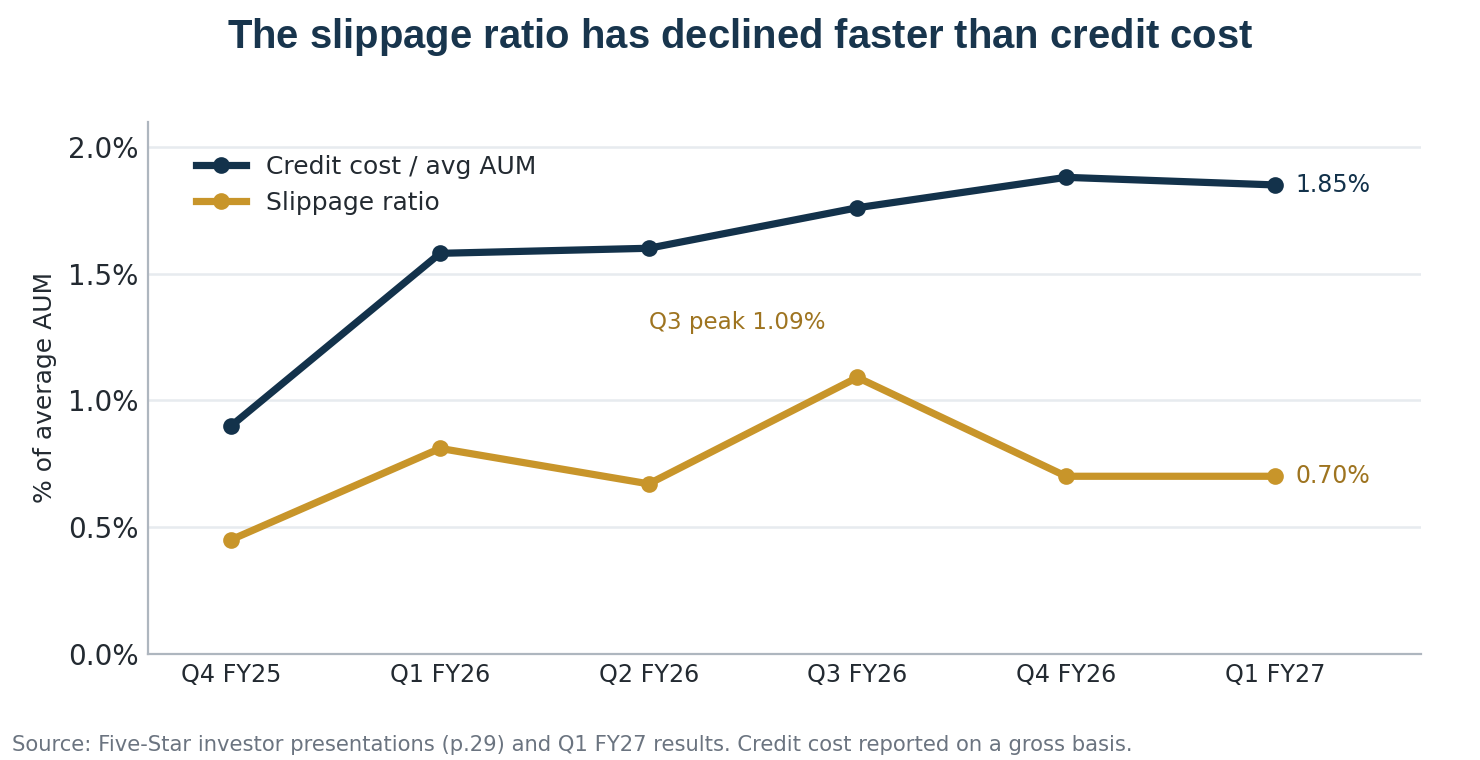
Source: Five-Star investor presentations (p.29) and Q1 FY27 results. Credit cost reported on a gross basis.
Provisioning has migrated toward the hard bucket
At June 2026, Five-Star reported Stage 1 ECL coverage of 0.14%, Stage 2 coverage of 3.05% and Stage 3 coverage of 40.14%, with overall ECL equal to 1.78% of gross loans. Management says it intends to maintain overall coverage at around 1.75–1.8%, while deciding the distribution across stages according to the portfolio mix.
The FY26 audited accounts show how the provisioning burden changed. Stage 3 gross loans increased from roughly ₹212 crore at March 2025 to ₹446 crore at March 2026, while the Stage 3 ECL allowance rose from about ₹109 crore to ₹185 crore. Overall loan impairment allowance increased from about ₹193 crore to ₹243 crore.
Stage 1 and Stage 2 allowance balances, however, declined over the same period even as the Stage 2 exposure increased. By Q1 FY27, Stage 2 gross loans were about ₹1,224 crore against ₹37 crore of ECL, while Stage 3 gross loans were about ₹475 crore against ₹191 crore of ECL.
The mix of provisioning has also shifted toward Stage 3. Stage 1 and Stage 2 coverage stood at 0.14% and 3.05% respectively in June, while Stage 3 coverage was 40.14%. An analyst on the Q1 call specifically asked whether the company would rebuild Stage 1 and Stage 2 coverage after the reduction seen over recent quarters. Management said it would instead manage to an overall coverage level of around 1.75–1.8%, with the allocation across stages determined by the evolving portfolio mix. If fresh slippages were to rise again, maintaining that overall coverage could require additional provisioning depending on how exposures migrate across stages.
Table 01
Five-Star Business Finance: Key risk indicators snapshot
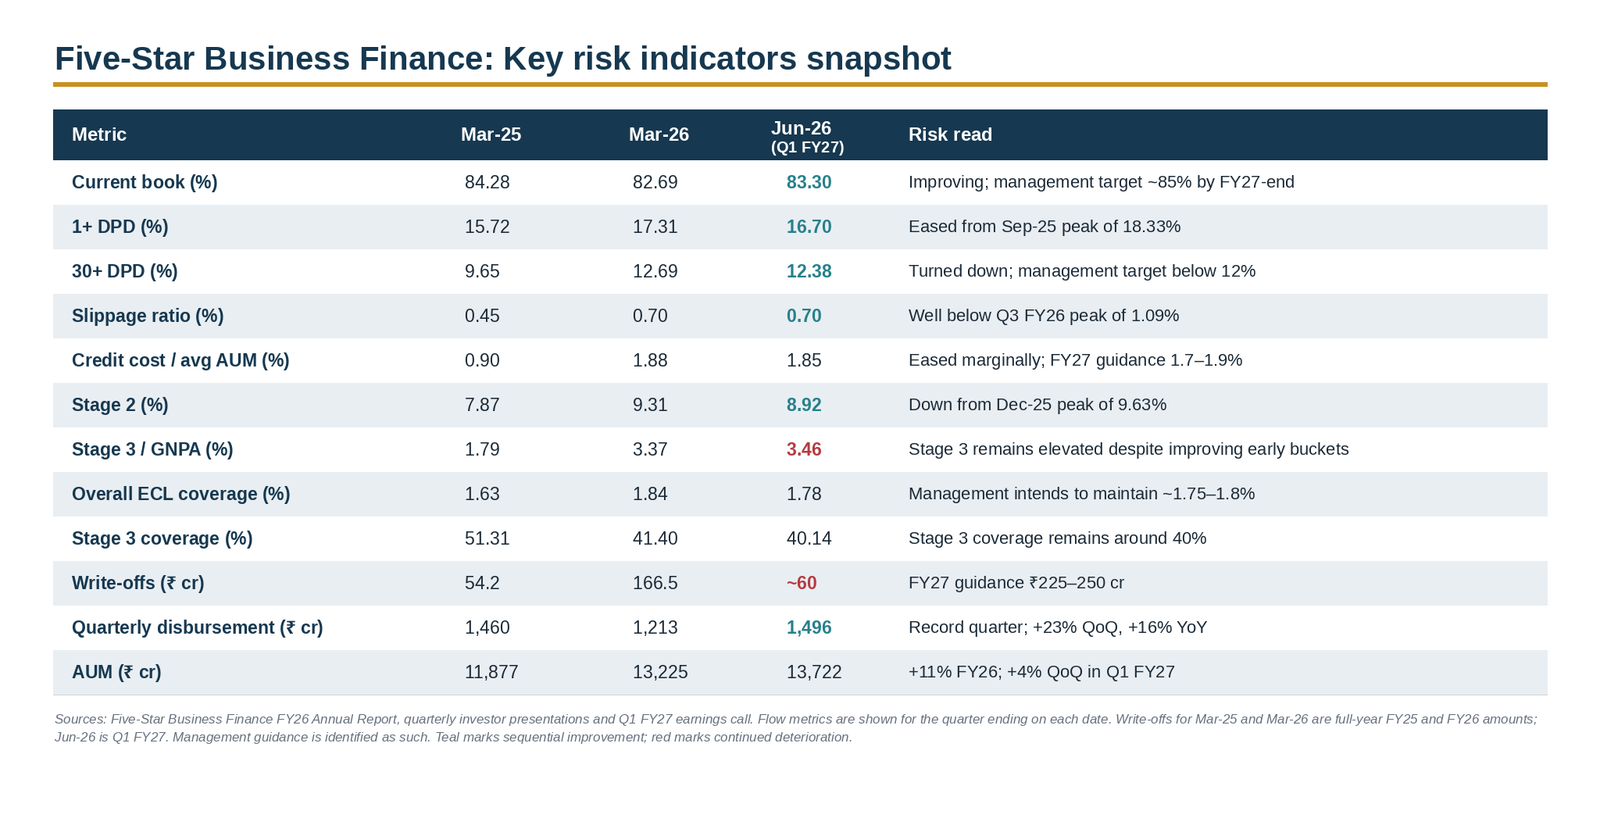
Sources: Five-Star Business Finance FY26 Annual Report, quarterly investor presentations and Q1 FY27 earnings call. Flow metrics are shown for the quarter ending on each date; write-offs approximate.
Growth has restarted only after collections stabilised
Five-Star deliberately moderated disbursements during FY26. Disbursements fell about 6% to ₹4,676 crore even as AUM grew 11% to ₹13,225 crore. The annual report describes the company as collections-first and links the lower disbursement run-rate to its decision to prioritise portfolio quality through the period of borrower overleverage stress.
Q1 FY27 marks a clear change in business momentum. Quarterly disbursements reached a record ₹1,496 crore, up 23% sequentially and 16% year-on-year, while AUM increased 4% to ₹13,722 crore.
Management attributes part of that acceleration to the separation of business and collections responsibilities. Employees who previously had to source new business while also managing difficult arrears can now focus on origination, while specialised collection teams handle stressed accounts. Management also said the higher disbursement run-rate has not come from loosening credit filters.
The mix of new business has changed as well. Five-Star had already moved away from very small tickets after they showed higher stress. The average ticket size of loans disbursed increased from ₹3.58 lakh in FY25 to ₹3.93 lakh in FY26. Management expects the average quarterly disbursement ticket to move toward ₹4.5–5 lakh. Its stated portfolio preference is roughly 25% around ₹3 lakh, 50% around ₹5 lakh and the balance closer to ₹10 lakh.
This matters because Q1 is not simply a collections recovery quarter. It is also the point at which the company has restarted growth after waiting for the front-end risk indicators to stabilise.
What normalisation would look like
Five-Star has given unusually explicit markers for the portfolio it considers sustainable. For FY27, management expects the current book to move toward 85%, 30+ DPD to fall below 12%, and credit cost to remain in a 1.7–1.9% range, with commentary pointing toward the lower end if the current trend holds.
Separately, it describes a steady-state portfolio — not a FY27 exit target — with Stage 1 at roughly 91–92%, Stage 2 at 6–7%, Stage 3 around 2.5% and gross NPA settling below 3%. Those are management targets rather than FoFiPulse forecasts, but they give investors a measurable framework for reading the next phase of the recovery.
The most useful sequence to watch is therefore: current-book collections first, then 1+ and 30+, then Stage 2 and slippages, and only after that GNPA and credit cost. Five-Star’s Q1 FY27 data are currently consistent with the first half of that sequence improving while the second half is still carrying the FY26 backlog.
Conclusion
Five-Star’s asset-quality normalisation is not yet complete. GNPA is still rising, credit cost remains well above its pre-stress level and write-offs are expected to stay elevated through FY27.
But the direction of the leading indicators has changed. The current book is improving, 1+ and 30+ DPD are falling, Stage 2 has begun to decline and slippages are materially below their Q3 FY26 peak. Those movements are occurring before Stage 3 has turned.
That distinction is the core of the current risk picture. Formation of new stress appears to have slowed before the existing stock of stressed loans has cleared. Five-Star has also restarted disbursement growth only after those front-end collection metrics strengthened — with the sustainability of that recovery depending on the improvement in front-end flow rates being maintained.
Whether that divergence closes through lower GNPA and credit cost will depend on how the existing Stage 3 stock cures, is recovered or is written off. For now, the improvement is visible first where delinquency begins — not yet where it ends.
Sources: Five-Star Business Finance FY26 Annual Report; quarterly investor presentations through Q1 FY27; and the Q1 FY27 earnings-call transcript.
Method note: FoFiPulse analysis uses company-reported metrics and management guidance as disclosed. Jun-26 stage shares are calculated from company-reported stage-wise gross loan balances. Management guidance and steady-state ranges are not FoFiPulse forecasts.