
Analysis · NBFC · Peer Comparison
Beyond the Giants: Four Mid-Sized NBFCs, Four Different Credit-Risk Curves
UGRO Capital, MAS Financial, SBFC Finance and Five-Star Business Finance ended Q1 FY27 at broadly comparable balance-sheet scale. But their disclosures show credit risk sitting at very different points in the delinquency cycle.
Three lenders ended Q1 FY27 with almost the same headline asset-quality number.
MAS Financial reported gross Stage 3 assets at 2.58%. UGRO Capital reported GNPA at 2.60%. SBFC Finance was at 2.66%. The entire spread between them was just eight basis points. Five-Star Business Finance was higher at 3.46%.
Taken alone, those numbers appear to offer a simple comparison. But the underlying credit data tell a much less uniform story.
At UGRO, the relevant issue is the seasoning of newer growth portfolios. At MAS Financial, the front of the delinquency curve remains relatively stable while some stress persists deeper in the tail. At SBFC, warning signals are appearing before any material deterioration in headline GNPA. Five-Star shows almost the reverse: early delinquency indicators are improving while the stock of Stage 3 assets has yet to turn.
The distinction matters because GNPA is only one point in the credit lifecycle. A loan generally moves through several stages before a lender records the final credit outcome: repayment behaviour weakens, early delinquency appears, accounts migrate through harder buckets, Stage 2 exposure changes, Stage 3 is recognised, provisions are taken and, eventually, recoveries or write-offs follow. Looking at where each lender sits along that path gives a different picture from comparing GNPA alone.
Figure 01
Similar headline GNPA, very different credit-risk states
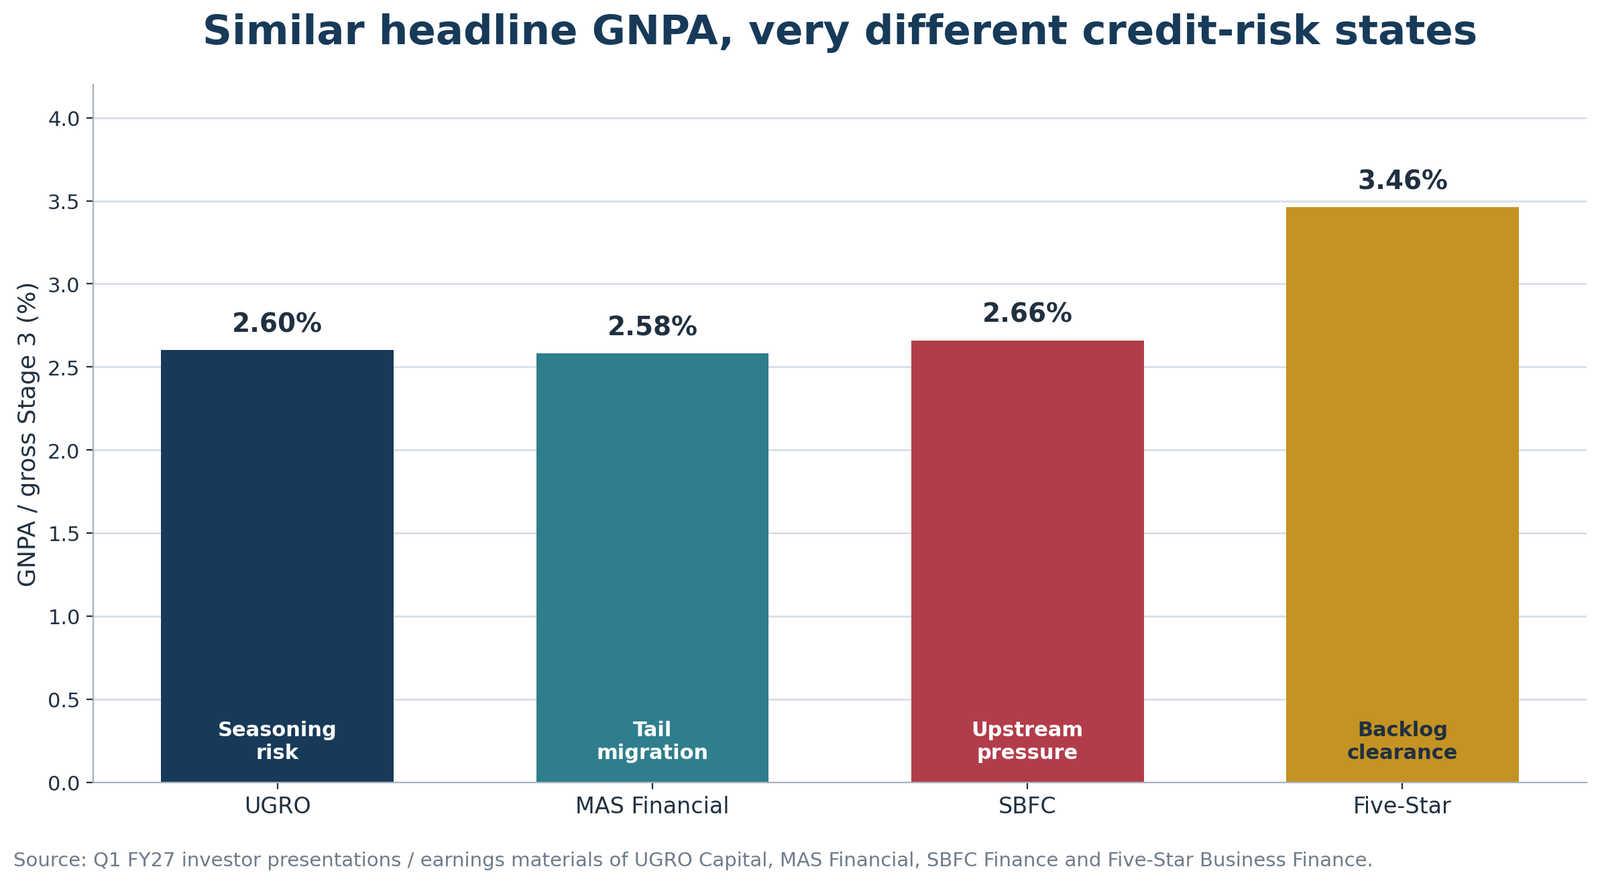
Source: Q1 FY27 investor presentations and earnings materials of UGRO Capital, MAS Financial, SBFC Finance and Five-Star Business Finance.
GNPA is the destination, not the whole journey
The four lenders provide a useful comparison because their Q1 FY27 AUMs are in a relatively narrow band: approximately ₹15,013 crore at UGRO, ₹15,147 crore at MAS Financial, ₹11,922 crore at SBFC and ₹13,722 crore at Five-Star. The headline Stage 3 numbers are also relatively close for three of them. But what precedes those numbers is not.
For a comparative risk framework, it is useful to separate five layers. Formation: are borrowers beginning to miss payments? Migration: are those early delinquencies moving into harder buckets or Stage 2? Recognition: how much stress has already reached GNPA or Stage 3? Absorption: how much is being recognised through provisions, overlays and credit cost? Response: is management tightening underwriting, slowing growth, changing product mix or strengthening collections?
Once the four lenders are viewed through those layers, the similarities in headline GNPA become much less meaningful.
UGRO: the newer book is still seasoning
UGRO ended June 2026 with consolidated AUM of ₹15,013 crore, Stage 2 at 4.9% and Stage 3 at 2.6%. The movement from March is modest, but directionally relevant: Stage 2 had been around 4.4%, while Stage 3 was around 2.5%.
That matters because UGRO is not operating a static portfolio. A significant part of its strategy is shifting toward Emerging Market LAP and Embedded Merchant Finance. At June 2026, Emerging Market LAP had reached approximately ₹3,896 crore of AUM, while Embedded Merchant Finance was around ₹3,003 crore. Both reported GNPA of roughly 2.1% at June.
But the two portfolios do not carry the same underlying credit economics. Emerging Market LAP is secured. Management has indicated that its mature GNPA can settle around 3–3.5%, while only a portion of that is expected to translate into ultimate credit cost because recoveries continue after delinquency. Embedded Merchant Finance is unsecured and much higher-yielding, but a larger share of delinquency translates into loss.
The relevant question for UGRO is therefore not whether 2.6% GNPA is high or low in isolation. It is whether these newer portfolios mature within the loss assumptions underpinning the company’s changing business mix.
That makes UGRO primarily a seasoning story. Its June ratios remain interim outcomes for portfolios that are still moving toward mature behaviour. The rise in Stage 2 deserves monitoring, but it cannot be read independently of the rapid change in portfolio composition. UGRO also reported credit cost of 2.8% for Q1 FY27 and management commentary indicated Stage 3 provision coverage of around 45%. The next few quarters should therefore show whether the growth portfolios continue to season along the paths management has described, or whether the eventual loss curves move differently.
MAS Financial: front-end stability, but the tail remains
MAS Financial offers a very different credit profile. Standalone AUM stood at approximately ₹15,147 crore at June 2026, with gross Stage 3 assets at 2.58% of AUM. That number is almost identical to UGRO’s 2.60%. But MAS provides enough DPD detail to see what is happening underneath.
Between March and June 2026, Zero DPD improved from 93.42% to 93.55%; 1–30 DPD declined from 1.92% to 1.86%; 31–60 DPD increased from 0.76% to 0.97%; 61–90 DPD declined from 1.34% to 1.04%; 91–120 DPD declined from 0.72% to 0.56%; but >120 DPD increased from 1.85% to 2.02%. Gross Stage 3 itself barely moved, from 2.57% to 2.58%.
This does not look like a broad deterioration across the delinquency curve. Entry into delinquency remains relatively controlled, and several intermediate buckets have improved. But the older tail has not disappeared. That makes MAS less of a fresh-stress formation story and more of a tail-persistence and migration story.
Provisioning supports the same interpretation. Stage 1 and Stage 2 assets carried provisioning of 0.70% at June, up from 0.65% in March, while Stage 3 provisioning stood at 41.36%. Total provisions including management and macroeconomic overlay were approximately ₹236 crore. For MAS, the more informative signal from here is not another few basis points of movement in Stage 3. It is whether the deeper delinquency buckets begin to contract rather than merely remain contained.
SBFC: the warning signal is appearing upstream
SBFC sits in a third position. Its Q1 FY27 AUM was ₹11,922 crore, while GNPA stood at 2.66% — only five basis points above March and still below the level reported a year earlier. Yet several indicators earlier in the credit funnel moved more materially.
Management reported that early delinquency increased during the quarter, while credit cost reached 1.45%. In its secured MSME portfolio, 1+ DPD stood at 9.18% at June. At the same time, origination became more selective. Login-to-disbursement conversion moved from roughly 42% to 34%, with management pointing to tighter selection alongside other market and operating factors.
The provisioning response had also begun before Q1. Stage 2 ECL coverage had been increased from roughly 6% to around 16% by FY26-end, and stood at 16.28% in June. Stage 3 coverage was 42.22%, while total ECL provisioning was 1.91% of the book.
That combination makes SBFC the clearest example in this group of a lender where the most useful risk signal currently sits upstream of GNPA. The reported NPA ratio remains relatively stable. But underwriting selectivity, early repayment behaviour and provision intensity have already changed.
That does not establish that those early signals will necessarily migrate into Stage 3. It means the next phase of the credit story will be decided before the headline NPA ratio moves materially. For SBFC, the relevant question is whether tighter origination and higher provisioning contain that pressure near the front of the curve.
Five-Star: the front is improving before Stage 3
Five-Star provides almost the mirror image. Its Q1 FY27 loan portfolio stood at approximately ₹13,722 crore and GNPA increased from 3.37% in March to 3.46% in June. That is the highest Stage 3 ratio among the four lenders. But the leading indicators are moving in the opposite direction.
The current book improved from 82.69% to 83.30%. 1+ DPD fell from 17.31% to 16.70%. 30+ DPD declined from 12.69% to 12.38%. Stage 2 also moved down from 9.31% at March to approximately 8.92% at June, after peaking at 9.63% in December. And the slippage ratio remained at 0.70%, well below the 1.09% reached in Q3 FY26.
Five-Star’s GNPA is therefore still reflecting stress that has already travelled through the delinquency curve, while the front of that curve has started improving. Credit cost remains elevated at 1.85%, and Stage 3 coverage was 40.14%, so the existing stressed stock is still affecting the P&L. But the Q1 data are consistent with new stress formation slowing before the stock of recognised stress has fully cleared.
That distinction is important. SBFC and Five-Star can be viewed as opposite ends of the same process. At SBFC, the earlier warning indicators have strengthened before GNPA. At Five-Star, those earlier indicators have started improving before GNPA. The reported NPA line is lagging the underlying movement in both cases — but in opposite directions.
One caveat on the figure below: a lender’s position along the cycle marks where its most informative risk signal currently sits, not how healthy its book is. Five-Star appears furthest along precisely because its stress is already recognised — it carries the highest GNPA of the four — while SBFC sits earliest because its warning signs are only now emerging, not because its book is the cleanest. The horizontal axis is a diagnostic of where to look, not a ranking of credit quality.
Figure 02
Where the primary risk signal sits in each lender’s credit cycle
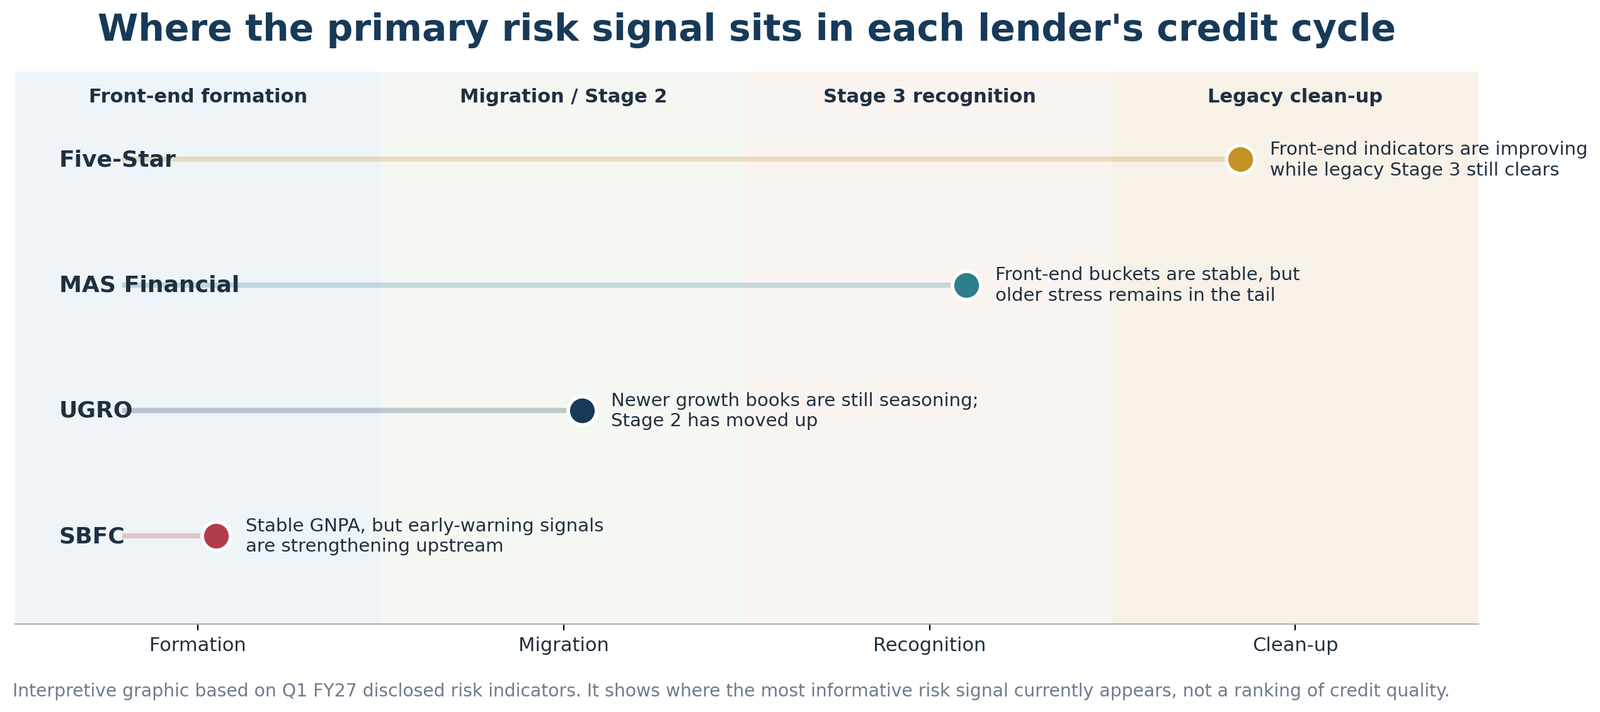
Interpretive graphic based on Q1 FY27 disclosed risk indicators; it shows where the most informative risk signal currently appears, not a ranking of credit quality.
The same GNPA can describe very different credit states
That brings the comparison back to the three lenders clustered around 2.6%: MAS at 2.58%, UGRO at 2.60% and SBFC at 2.66%. The difference between the highest and lowest is just eight basis points. But there is little reason to interpret those three numbers as equivalent credit situations.
The four books are not even the same kind of lending: UGRO blends secured Emerging Market LAP with unsecured merchant finance, SBFC is secured MSME plus gold, Five-Star is small-ticket secured business loans, and MAS runs a wholesale-plus-retail MSME and wheels book. A given GNPA level therefore sits on very different loss-given-default economics — the same 2.6% converts into materially different ultimate credit cost depending on collateral, ticket size and product. Cycle position is only half the story; the other half is what a defaulted rupee is actually worth once recovery runs its course.
UGRO is carrying portfolios whose mature loss behaviour is still being established. MAS has comparatively stable early buckets but persistent stress deeper in the delinquency tail. SBFC is seeing more movement in early indicators and provisioning than in reported GNPA. And Five-Star, despite carrying the highest GNPA at 3.46%, is currently showing improvement in several leading indicators.
The comparison therefore cannot be reduced to lower GNPA = better credit quality. A more useful question is: what is generating the reported GNPA, and in which direction are the indicators before it moving?
Table 01
Q1 FY27 credit-risk comparison snapshot
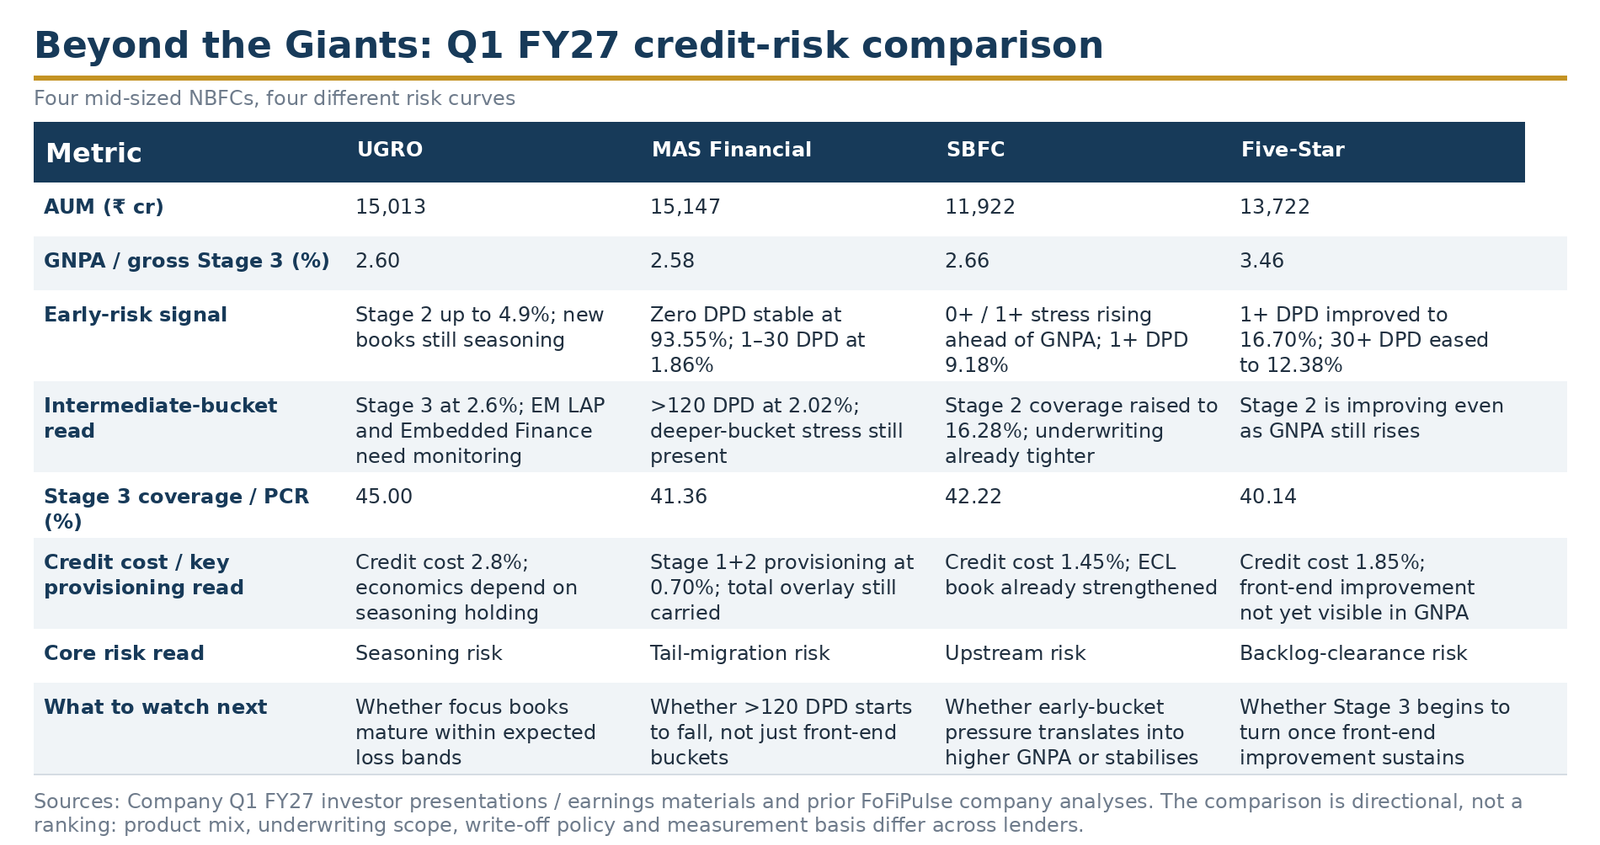
The comparison is directional, not a ranking: product mix, underwriting scope, write-off policy and measurement basis differ across lenders.
Stage 3 coverage is more similar than the risk trajectories
Provisioning adds another useful perspective. Despite the differences in risk direction, Stage 3 reserve coverage is relatively clustered: UGRO around 45%, SBFC 42.22%, MAS Financial 41.36% and Five-Star 40.14%.
Figure 03
Stage 3 coverage is clustered in a relatively narrow band
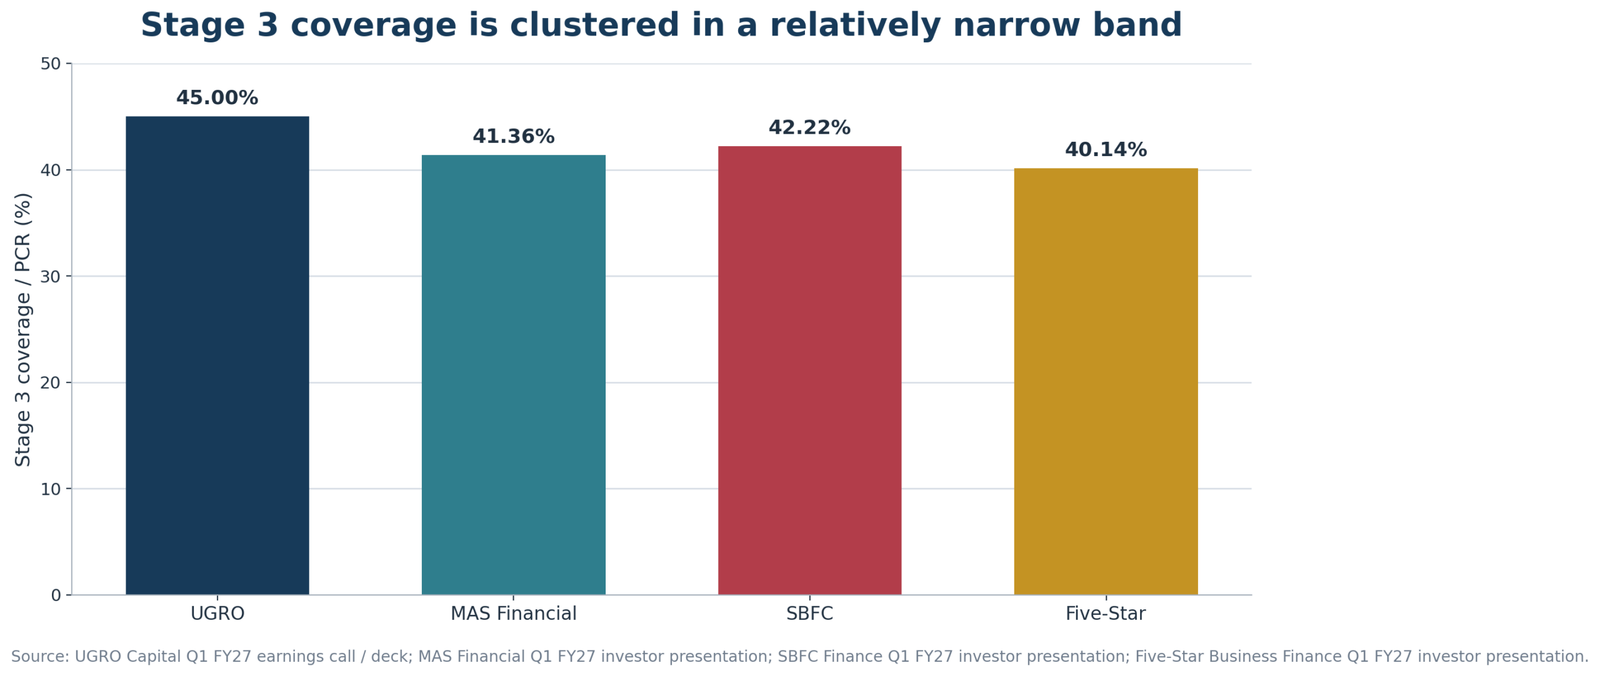
Source: Q1 FY27 earnings calls and investor presentations of UGRO Capital, MAS Financial, SBFC Finance and Five-Star Business Finance.
The range is narrower than the differences in the underlying credit stories. That suggests the principal distinction across the four lenders is not simply how much provision they hold against loans already in Stage 3. It is what is happening before loans arrive there.
For UGRO, that means portfolio seasoning and Stage 2 development. For MAS, it means the distribution of delinquency between the front and the tail. For SBFC, it means early-payment behaviour and Stage 2 provisioning. For Five-Star, it means whether improvements in current, 1+ and 30+ buckets eventually work through into lower Stage 3. The same reserve coverage can therefore sit behind very different future credit-cost trajectories.
What matters next
Each lender now has a different set of indicators that deserves priority. For UGRO, the key markers are Stage 2 migration and the mature delinquency behaviour of Emerging Market LAP and Embedded Merchant Finance; the headline consolidated GNPA will become more informative as those portfolios season. For MAS Financial, the focus should remain on whether the >120 DPD population begins to decline alongside the relatively stable front-end buckets.
For SBFC, 1+ DPD, Stage 2 coverage, credit cost and origination conversion are likely to say more in the near term than a few basis points of movement in GNPA. For Five-Star, current-book performance, 1+ DPD, 30+ DPD and slippages should indicate whether the improvement at the front of the curve is sustained long enough for Stage 3 to begin declining. These are different monitoring frameworks because the four portfolios are at different points in the credit cycle.
Conclusion
The four lenders are not simply carrying different amounts of credit risk. They are showing different stages of credit-risk formation and resolution. UGRO is still establishing how its newer growth portfolios season. MAS Financial’s early buckets remain relatively stable while some older stress persists deeper in the curve. SBFC is responding to signals appearing before headline NPA deterioration. Five-Star is showing the reverse pattern: leading indicators are improving while the existing Stage 3 stock has yet to decline.
That is why a peer comparison beginning and ending with GNPA can be misleading. Three companies can report almost the same NPA ratio while the next movement in their credit curves points in different directions.
GNPA tells us where stress has already arrived. The more useful comparative signal is often where the credit curve is moving before it gets there.
Sources: Q1 FY27 investor presentations, earnings-call commentary, annual-report disclosures and financial results from UGRO Capital, MAS Financial Services, SBFC Finance and Five-Star Business Finance.
Method note: The comparison is directional rather than a credit-quality ranking. Product mix, secured/unsecured composition, off-book exposure, ECL methodology, write-off policy and reporting scope differ across the four lenders. UGRO’s Q1 FY27 figures are on a consolidated presentation basis, while the MAS figures used for the core credit-quality comparison are standalone. Company guidance and portfolio-seasoning expectations are management commentary, not FoFiPulse forecasts.