
Analysis · Fintech · Digital Lending
Moneyview opens its IPO this week at a valuation ~41% below its 2024 private-market mark
The fintech is seeking a valuation of roughly ₹6,000 crore — well below its 2024 private-market mark — even as revenue, disbursals and managed assets have expanded. The more important question is what investors are actually being asked to value: a technology platform, a lender, or increasingly, both.
Moneyview will open its initial public offering on September 24 with a price band of ₹32–34 per share, seeking a valuation of up to approximately ₹5,985 crore.
The ₹1,092 crore offer consists of a ₹750 crore fresh issue and an offer for sale of roughly ₹342 crore by existing shareholders. The company expects to list on October 1.
Those numbers alone make this an interesting IPO.
But the more revealing number sits outside the offer document.
In 2024, Moneyview was valued at approximately ₹10,086 crore, or $1.2 billion, when it attained unicorn status.
At the top of the current IPO price band, that means Moneyview is entering the public market at a valuation roughly 41% below its 2024 mark in rupee terms.
Measured in dollars, the decline looks even larger — from around $1.2 billion to roughly $624 million — although part of that difference reflects the movement in the rupee.
That valuation reset is the obvious headline.
It is not, however, the whole story.
Figure 01
Moneyview’s valuation reset
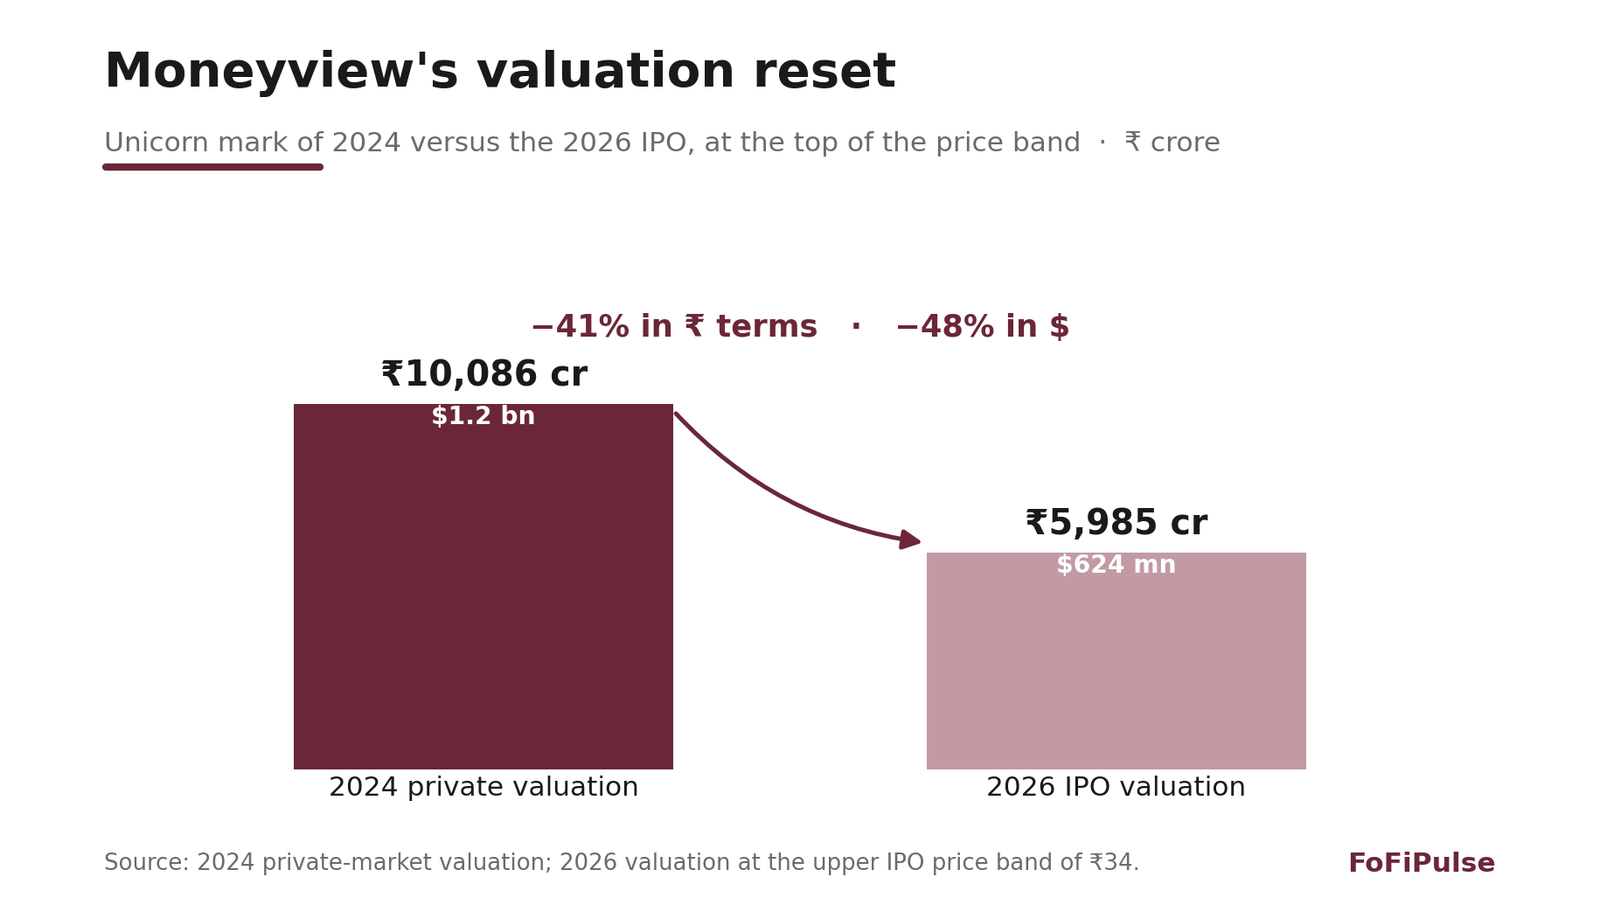
Source: 2024 private-market valuation; 2026 valuation at the upper IPO price band of ₹34.
The business underneath the valuation has grown
Moneyview’s operating scale has expanded considerably.
Total income rose from ₹1,389 crore in FY24 to ₹2,379 crore in FY25 and ₹3,404 crore in FY26. Managed AUM stood at approximately ₹22,520 crore as of June 2026, while FY26 loan disbursals reached roughly ₹23,099 crore, up 31% year-on-year.
A note on periods: this article draws on two filings. Full-year FY26 figures (to March 2026) and June-2026-quarter numbers (which fall in Q1 FY27) come from the updated prospectus, while the revenue-mix and DLG figures are from the March draft prospectus and are stated for the nine months to December 2025 (9M FY26).
The June quarter continued that growth.
Revenue from operations increased about 50% year-on-year to ₹1,041 crore, while reported profit after tax rose to ₹174 crore, against ₹67 crore in the corresponding quarter a year earlier.
That makes the valuation reset more interesting.
Moneyview isn’t coming to market after a collapse in its topline or lending franchise. Public investors are instead being asked to place a price on a business that has become larger — but whose economics have also evolved considerably.
Moneyview is no longer just a distribution platform
This may be the most important part of the story.
Moneyview began primarily as a technology-led platform connecting borrowers to financial institutions. But over time, more lending has moved onto the balance sheet of its NBFC subsidiary, Whizdm Finance.
The shift is visible in its revenue mix.
In FY23, 91.84% of Moneyview’s operating revenue came from fees and commissions, while interest income contributed only 6.91%.
By FY25, fee and commission income had fallen to 63.56% of operating revenue, while interest income had risen to 33.73%.
For the nine months ended December 2025, fee income fell further to 56.37%, while interest income reached 39.39%.
Figure 02
Moneyview is becoming more lending-intensive
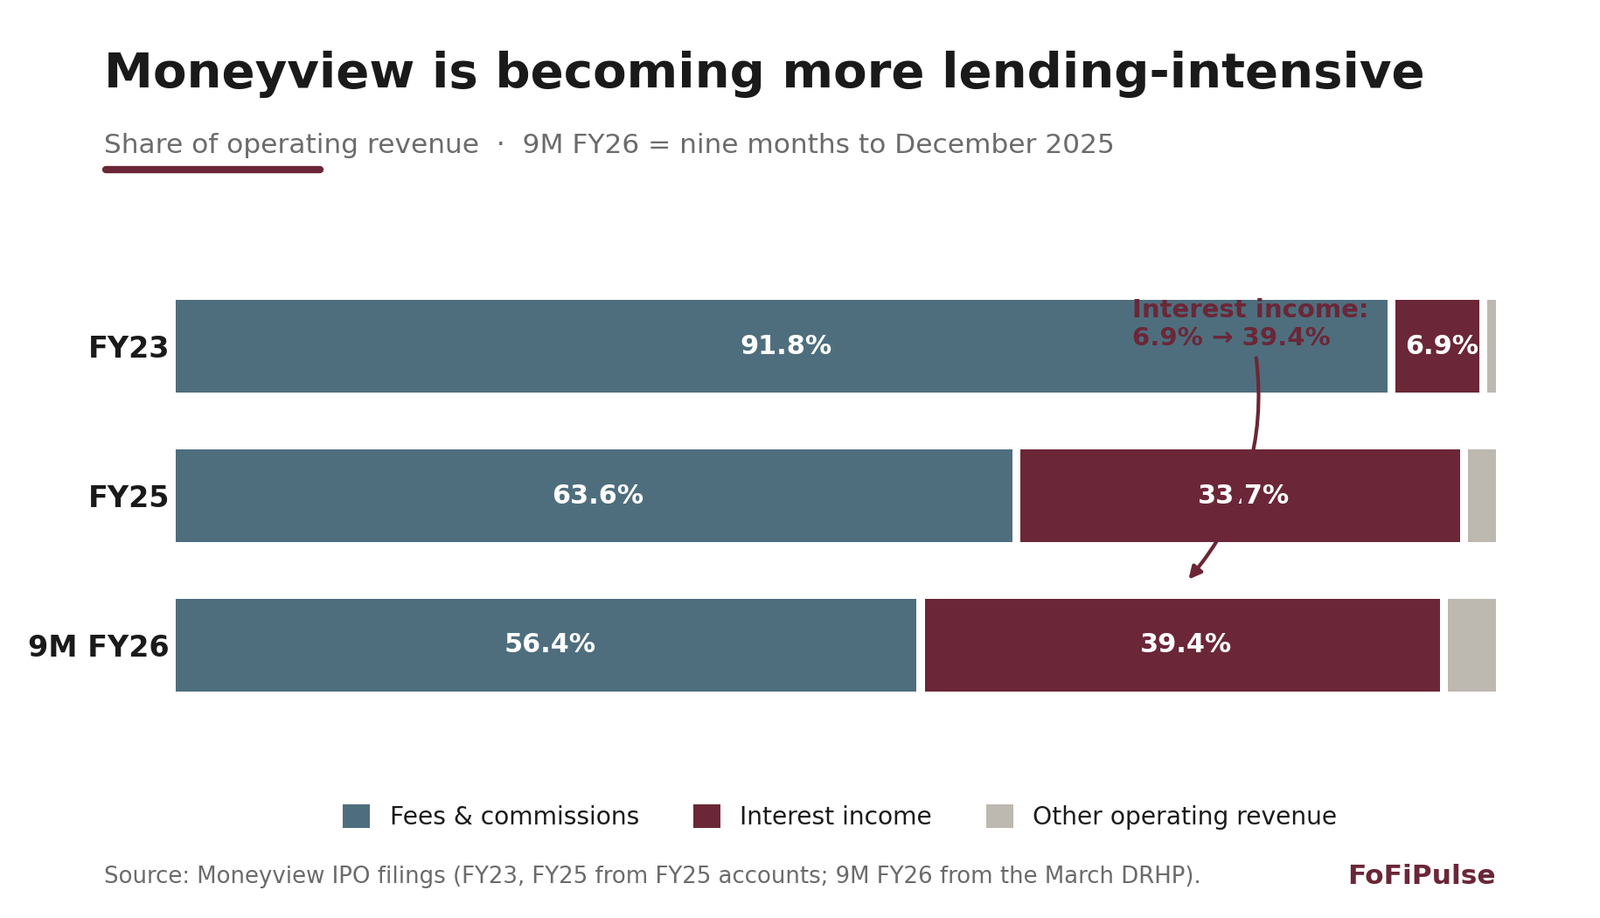
Source: Moneyview IPO filings. FY23 and FY25 from FY25 accounts; 9M FY26 from the March DRHP.
That changes how the company should be understood.
A pure marketplace can scale largely by bringing together borrowers and lenders. A lender requires capital, funding, provisioning and continuous management of credit risk.
Moneyview increasingly contains both models.
And that distinction matters enormously for valuation.
A technology platform may command a premium for scalability and low capital requirements. A lending business is usually judged much more heavily on credit costs, funding, leverage, asset quality and return on equity.
Moneyview sits somewhere between the two.
“Capital-light” doesn’t mean credit-risk free
There is another layer.
Even where loans remain on a partner lender’s balance sheet, Moneyview can participate in the credit risk through default loss guarantee, or DLG, arrangements.
Under these arrangements, Moneyview can provide protection of up to 5% of the relevant loan portfolio to regulated lending partners.
Its March IPO filing showed that Moneyview had facilitated about ₹9,166 crore of disbursements under DLG partnerships during the first nine months of FY26. DLG expense during that period was approximately ₹319 crore, representing more than 15% of total expenses. Outstanding DLG obligations stood at about ₹847 crore at December 2025.
Figure 03
Moneyview’s DLG exposure is meaningful
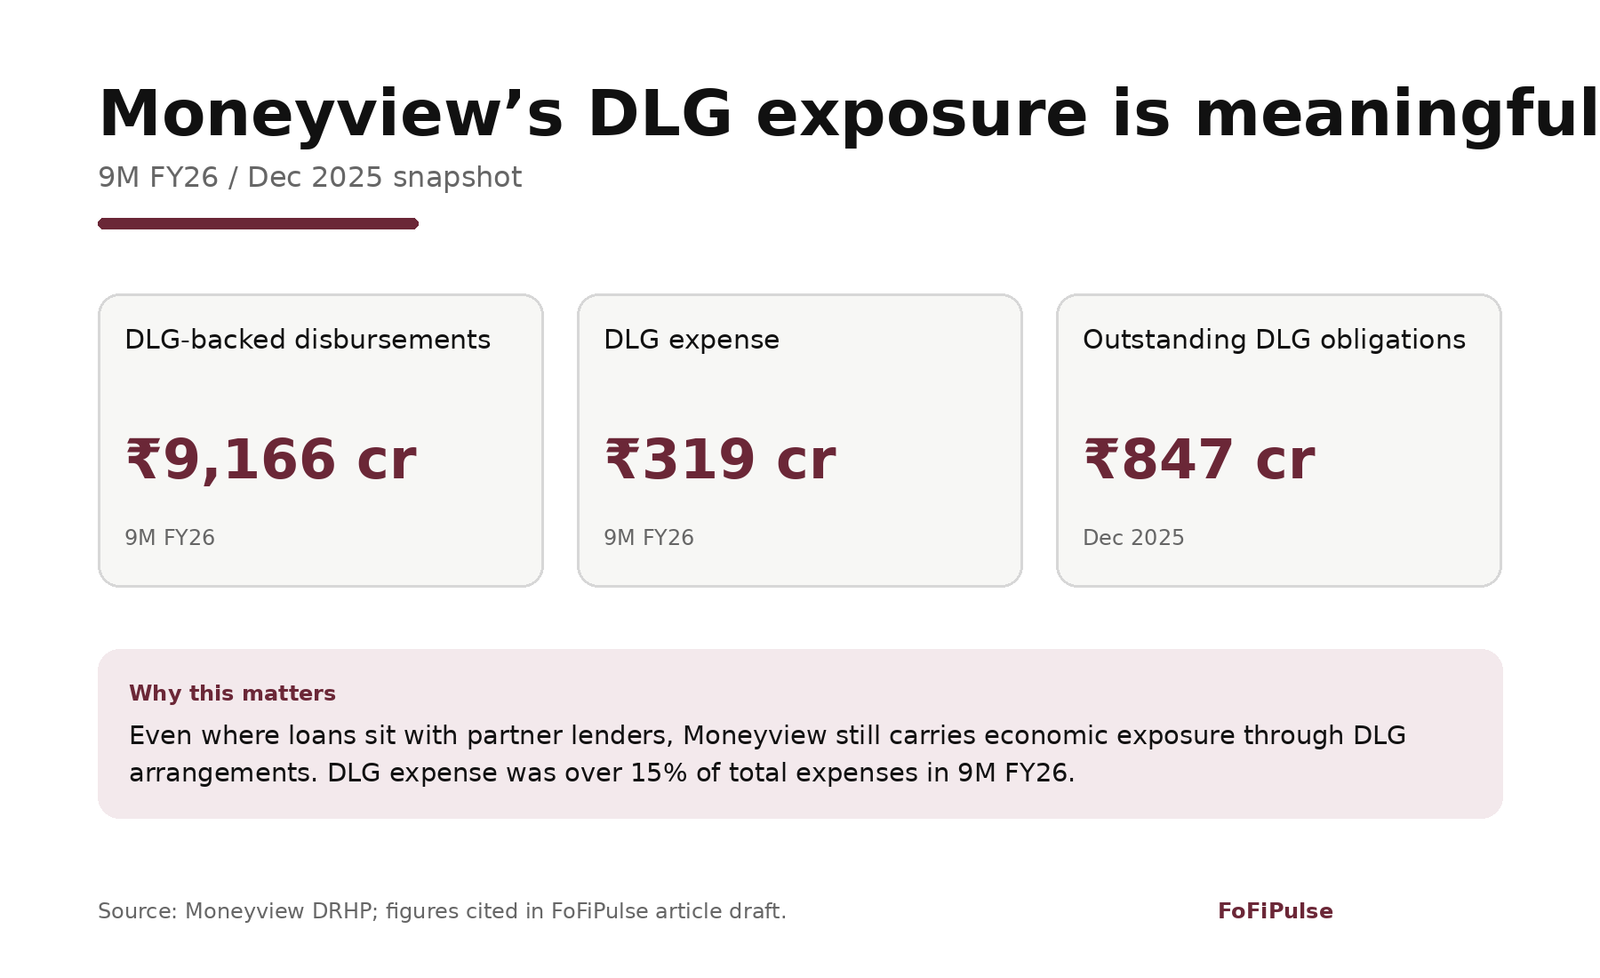
Source: Moneyview DRHP.
This is an important nuance in the “platform versus lender” debate.
A loan does not necessarily have to sit on Moneyview’s own balance sheet for its performance to affect Moneyview’s P&L.
And the IPO itself reinforces this model.
Of the ₹750 crore being raised through fresh shares, ₹325 crore is intended to support further loan disbursals under DLG arrangements, while another ₹250 crore will be invested into Whizdm Finance to strengthen its capital base.
In other words, a large part of the new equity capital is being raised specifically to support the credit engine — both partner-originated and on-balance-sheet.
What the credit numbers show so far
For a business now substantially in the lending game, the filing’s asset-quality disclosures matter as much as its growth. Gross Stage 3 loans — which the filing defines as loans more than 90 days past due, together with all other loans of the same customer — rose from 0.94% at March 2024 to 2.53% at December 2025, a meaningful climb even if the absolute level stays moderate. Cutting the other way, the annualised loss rate eased from 7.93% in FY24 to 7.07% in FY25, below the roughly 9.35% industry average cited in the filing. The read is mixed rather than alarming: headline delinquency is drifting up, while realised losses remain contained and better than peers — which is exactly the tension a lender’s valuation has to weigh.
Funding is the other half of the equation. Whizdm’s average cost of borrowings ran near 14.4% in FY25 and held broadly flat through the nine months to December 2025, against a yield on advances of roughly 27.8% — a wide gross spread that must still absorb credit costs and operating expenses before anything reaches shareholders. India Ratings carries the NBFC at A- (stable), and consolidated leverage was a relatively conservative ~1.9x at FY25. Whether that spread and rating hold as the book scales and funding competition intensifies is among the clearest things public markets will now re-price each quarter.
Set against that, DLG remains an important credit-cost line to watch. The ₹325 crore earmarked from the fresh issue for future DLG-backed disbursals and the ₹847 crore of outstanding DLG obligations at December 2025 describe different things and should not be treated as directly comparable measures of coverage. What is clear from the filing is that DLG expense was already ₹319 crore in the first nine months of FY26, making partner-originated credit performance a meaningful determinant of profitability even when the underlying loans sit on partner lenders’ balance sheets. If loss rates rise, this expense line could become more material.
The IPO itself has become smaller
Moneyview’s current offer is also materially smaller than originally envisaged.
When it filed its draft prospectus in March, the company proposed a ₹1,500 crore fresh issue and an OFS of up to 13.61 crore shares.
The fresh issue has since been halved to ₹750 crore, while the OFS has been reduced to about 10.05 crore shares. Several institutional investors, including Accel, Tiger Global, Ribbit Capital and Crimson Winter, reduced the number of shares they intend to sell.
The planned deployment of fresh capital was reduced as well: funding earmarked for DLG-backed disbursals fell from ₹650 crore to ₹325 crore, while the planned capital injection into Whizdm Finance was cut from ₹450 crore to ₹250 crore.
That should not automatically be read as either positive or negative. IPO sizes can change because of capital requirements, market feedback, pricing considerations or offer construction.
But it does show that the transaction reaching investors in September looks materially different from the one Moneyview envisaged in March.
What is the market being asked to pay?
At a valuation of around ₹5,985 crore, Moneyview is being offered at roughly 1.8x FY26 revenue and 24.7x reported FY26 profit after tax.
Those simple multiples need qualification.
FY26 revenue increased more than 40%, while reported PAT remained almost unchanged at approximately ₹243 crore. The year included exceptional compensation-related expenses, while the June 2026 quarter showed materially stronger profitability.
On a forward-looking basis the arithmetic shifts sharply. Annualising the June 2026 quarter’s ₹174 crore profit implies a run-rate of roughly ₹696 crore, which would place the same ₹5,985 crore valuation at about 8.6x earnings rather than 24.7x. The truth almost certainly sits between the two — the trailing figure is depressed by one-off costs, while annualising a single strong quarter is an optimistic anchor — but the spread between 8.6x and 24.7x shows how little the headline P/E tells you on its own.
So the valuation debate cannot be reduced to one trailing P/E number.
Instead, public investors will have to answer several deeper questions.
- Can Moneyview continue growing disbursals without credit costs rising disproportionately?
- Can its underwriting models maintain performance through different credit cycles?
- How much of future growth can remain capital-efficient, and how much will require an expanding NBFC balance sheet?
- Can newer products — insurance, cards, secured loans, payments and investments — reduce dependence on unsecured personal lending?
- And, perhaps most importantly, should Moneyview eventually be valued primarily as a financial-services platform, as a consumer lender, or as a hybrid of the two?
The IPO could become a useful benchmark
That is why Moneyview’s listing matters beyond Moneyview itself.
India now has several scaled digital-credit businesses approaching public-market maturity. Their private-market years were built around user acquisition, technology, distribution and rapid origination growth.
Public markets bring another layer of scrutiny.
They can see the growth — but they will also continuously price funding costs, credit losses, leverage, capital consumption and return on equity.
Moneyview is arriving at that transition with more than 140 million registered users, ₹22,500 crore of managed AUM and a profitable business.
Yet it is doing so at a valuation considerably below the headline unicorn valuation attached to it two years ago.
That does not necessarily mean the business has deteriorated.
It may instead illustrate something more consequential for India’s fintech sector:
Private markets and public markets can place very different values on the same growth — particularly when that growth carries credit risk.
For Moneyview, September 24 begins the price-discovery process.
For India’s digital lenders, the result could provide a much broader valuation reference point.
Sources: Moneyview IPO filings, including the March 2026 Draft Red Herring Prospectus and the updated prospectus; 2024 private-market valuation references used in the article.
Period note: Full-year FY26 figures and the June 2026 quarter come from the updated prospectus. Revenue-mix and DLG figures are from the March DRHP and are stated for the nine months to December 2025 (9M FY26). Chart data use the figures cited in the article.